Percolation Centrality
Definition
The Percolation Centrality is defined for a given node, at a given time, as the proportion of ‘percolated paths’ that go through that node. A ‘percolated path’ is a shortest path between a pair of nodes, where the source node is percolated (e.g., infected). The target node can be percolated or non-percolated, or in a partially percolated state [PIRAVEENAN, M., 2013].
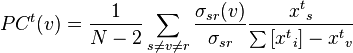
Formally, percolation centrality of node v at time t is:
The attached weights to the percolation paths depend on the percolation
levels assigned to the source nodes, based on the premise that the higher the
percolation level of a source node is, the more important are the paths that
originate from that node. Nodes which lie on shortest paths originating from
highly percolated nodes are therefore potentially more important to the
percolation. The definition of PC may also be extended to include target node
weights as well.
Percolation of a ‘contagion’ occurs in
complex networks in a number of scenarios. For example, viral or bacterial
infection can spread over social networks of people, known as contact networks.
The spread of disease can also be considered at a higher level of abstraction,
by contemplating a network of towns or population centres, connected by road,
rail or air links. Computer viruses can spread over computer networks. Rumours
or news about business offers and deals can also spread via social networks of
people. In all of these scenarios, a ‘contagion’ spreads over the links of a
complex network, altering the ‘states’ of the nodes as it spreads, either
recoverably or otherwise. For example, in an epidemiological scenario,
individuals go from ‘susceptible’ to ‘infected’ state as the infection spreads.
The states the individual nodes can take in the above examples could be binary
(such as received/not received a piece of news), discrete
(susceptible/infected/recovered), or even continuous (such as the proportion of
infected people in a town), as the contagion spreads. The common feature in all
these scenarios is that the spread of contagion results in the change of node
states in networks. Percolation centrality (PC) was proposed with this in mind,
which specifically measures the importance of nodes in terms of aiding the
percolation through the network [Centrality. (2014, July 31). In Wikipedia].
de Limaa, A.M., da Silvaa, M.V. and Vignattia, A.L., Percolation Centrality via Rademacher Complexity.
de Lima, A.M., da Silva, M.V. and Vignatti, A.L., 2019. Approximating the Percolation Centrality through Sampling and Pseudo-dimension. arXiv preprint arXiv:1910.00494.
Software
References
- Centrality. (2014, July 31). In Wikipedia, The Free Encyclopedia. Retrieved 10:39, August 6, 2014, from http://en.wikipedia.org/wiki/Centrality#Percolation_Centrality
- PIRAVEENAN, M., PROKOPENKO, M. & HOSSAIN, L. 2013. Percolation Centrality: Quantifying Graph-Theoretic Impact of Nodes during Percolation in Networks. PLoS ONE, 8, e53095.
- Saad, K.M., 2017. Bulk Synchronous Parallel Implementation of Percolation Centrality for Large Scale Graphs (Doctoral dissertation, Case Western Reserve University).